
Your VTS data already knows where the risk is.
DeviationIQ turns your existing vehicle-tracking and e-lock data into actionable intelligence — identifying route deviations, abnormal halts, overspeeding patterns, journey risks and cargo-security hotspots so your team knows where to act first.
Built from 12+ years of VTS, e-lock and field-operations experience across petroleum logistics.
From movement to meaning.
Watch the overview
A short narrated walkthrough (under 4 minutes) of what DeviationIQ analyses, how a review works, and what you receive.
What we analyse
Using the exports and reports your existing VTS and e-lock portals already produce.
Deviation & halt hotspots
Find recurring route-deviation and abnormal-halt hotspots, ranked by location, vehicle, route and frequency.
Overspeeding patterns
Identify recurring overspeeding patterns, high-risk vehicles, routes and time windows so interventions focus where they matter.
Risk-ranked journeys
Combine deviations, halts, speed, timing and location patterns to rank journeys and corridors by operational risk.
Beyond single tamper alerts
Correlate lock/unlock events with geofences, deviations, halts and journey stages to identify recurring risk patterns.
Pilferage risk mapping
Surface locations and journey patterns associated with elevated pilferage or cargo-security risk for investigation.
MoM & YoY comparison
Compare month-on-month and year-on-year performance to show whether corrective actions are reducing recurring exceptions.
How it works
We plug into reporting you already have access to — nothing new to install.
Share your data
Provide the VTS / e-lock reports or exports you already use.
We analyse
We structure the data, identify patterns, rank hotspots and correlate related events.
You get intelligence
Receive a management-ready report with findings, risk rankings, trend comparisons and specific actions.
Track improvement
Repeat monthly or quarterly to measure whether agreed interventions are reducing recurrence.
What you get
Every review comes back as a structured, management-ready package.
See it in action
Explore an interactive dashboard built entirely on synthetic data: recurring hotspots, vehicle risk profiles, e-lock signals and the actions a real report would recommend.
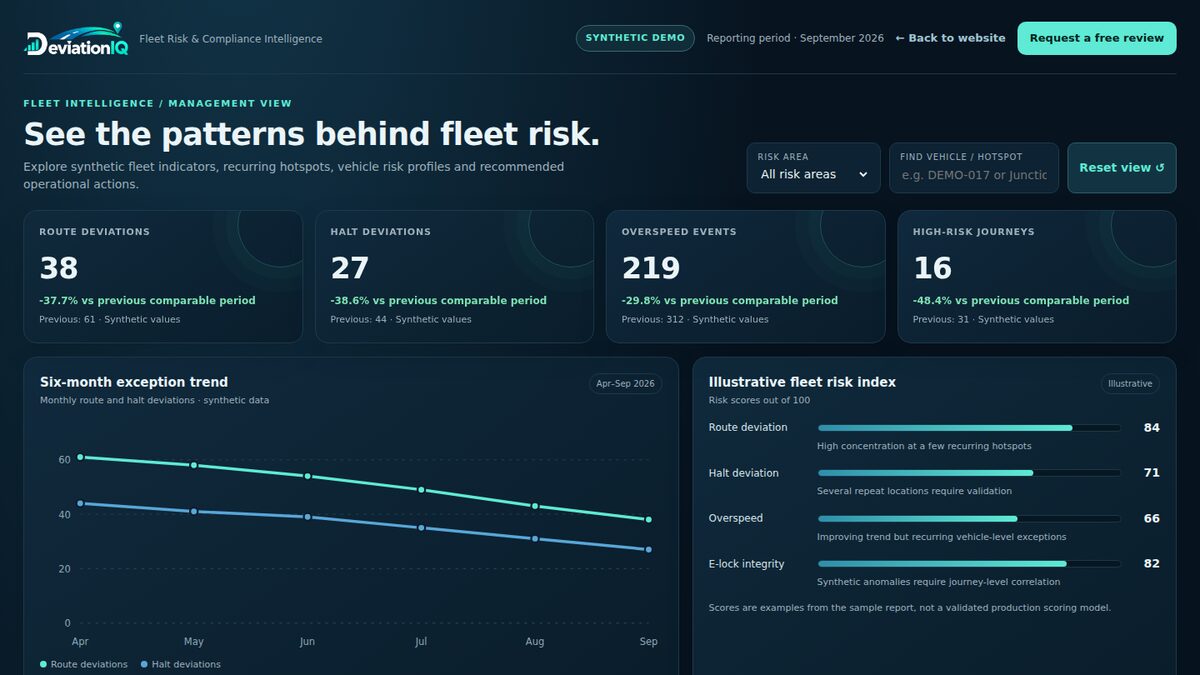
Interactive fleet risk demo
Filter by risk area, search vehicles and hotspots, and tick off recommended actions. No sign-up needed.
Open the demo →Sample insight
Don't just count the violations. Find the pattern behind them.
A number like that can look large on its own. DeviationIQ asks a better question: which five locations account for the largest recurring share, which vehicles are repeatedly involved, when do the events occur, and did the same pattern exist last year?
Why DeviationIQ
Built from the field, not just from dashboards.
DeviationIQ was founded by Satish Kumar Rayudu, drawing on more than 12 years of hands-on experience in vehicle tracking, e-lock operations, fleet support and petroleum logistics. The focus isn't simply on what a dashboard shows, but on what the underlying events mean operationally — and what teams can do about them.
- VTS and e-lock coordination
- Field-team leadership
- Route / geofence configuration
- Exception investigation
- Device-health monitoring
- MIS analysis & stakeholder training
WHO WE'RE BUILT FOR

Already have a VTS platform? You don't need another one.
DeviationIQ complements existing VTS and e-lock infrastructure by analysing the data those systems already generate. The initial service can work from authorised reports/exports; API integration can be introduced later where supported.
Free first review
Send us one month of authorised sample fleet data. We'll demonstrate the type of insight it can reveal:
- Top deviation hotspots
- Abnormal halt patterns
- Overspeed trends
- High-risk vehicles
- Journey-risk signals
- Potential cargo-security risk areas
Sample data should be synthetic or anonymised. Customer data will only be analysed with appropriate permission.
FAQ
Do we need new GPS devices?
No. The initial DeviationIQ service is designed to work with data from your existing VTS and e-lock systems.
Do you replace our VTS portal?
No. DeviationIQ complements your existing tracking infrastructure by analysing the data it generates.
Can you analyse historical data?
Yes, where authorised historical reports are available and sufficiently consistent for comparison.
Can you identify theft?
DeviationIQ identifies patterns and locations associated with elevated cargo-security or pilferage risk. Actual incidents require operational investigation and verification.
How often can we receive reports?
Monthly, quarterly, or according to the agreed operational requirement.
Doing something is better than doing nothing.
Let's look at your fleet data
A free first review — send an authorised sample export and we'll show you what the data can reveal.